
XRP Average Long-Term Trader Still Down 11.75% After Rebound


Key Takeaways
- XRP’s average unrealized return for coins active in the past year stood at minus 11.75%.
- Dogecoin showed a deeper loss of 19.26% on the same measure.
- Bitcoin, ether, and chainlink showed small average gains.
XRP Remains in the Red After Its Rebound
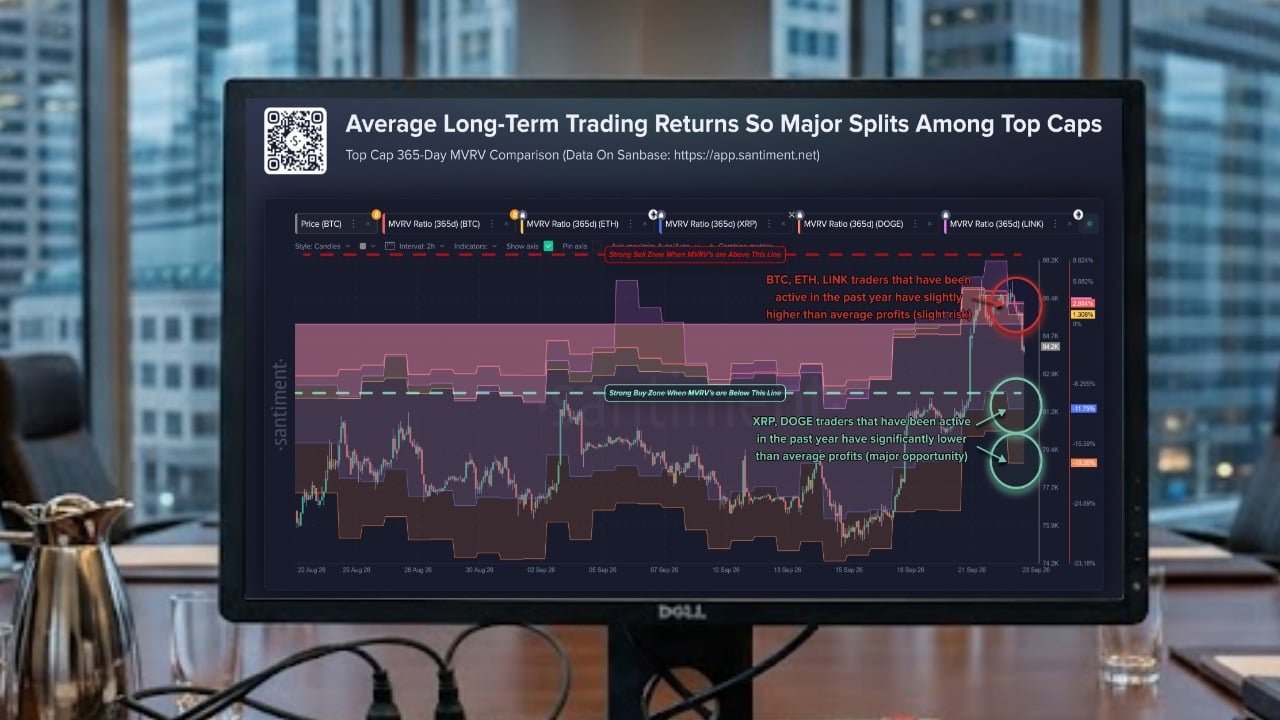
XRP and dogecoin were the only two coins showing average losses in Santiment’s Sept. 23 comparison of five crypto tokens: XRP, dogecoin, bitcoin, ether, and chainlink. The analytics firm’s comparison of five major cryptocurrencies shared on X placed XRP at minus 11.75% and dogecoin at minus 19.26%. Bitcoin, ether, and chainlink were slightly above zero. Santiment used 365-day market value to realized value (MVRV), which compares the current value of coins that moved within the past year with their value at acquisition price.
The XRP reading remained negative even after the token’s recent price surge. XRP rose above $1.60 on Sept. 22, while Santiment counted 1,917 large transactions and 3,647 new wallets. The price increase raised the current value of XRP, but it was not enough to bring the coins in Santiment’s yearlong calculation back to their average acquisition value.
Santiment views those remaining losses as a potentially favorable setup if demand improves. The firm wrote:
“Buying during that pain has historically offered better long-term setups.”
Its reasoning is that when most holders already sit on losses, fewer traders hold profits they could sell. A negative reading, however, measures current paper losses; it does not predict a price increase.
How Santiment Measures Trader Returns
A negative MVRV reading means the coins in the calculation are worth less, on average, than their recorded acquisition value. Santiment’s market value to realized value measure uses their current value and their acquisition price. XRP’s minus 11.75% reading represents an aggregate unrealized loss, so an individual holder could have a larger loss or a profit.
Santiment can apply the same calculation to shorter periods, but the resulting figures describe different groups of coins. In May, its 30-day XRP measure showed an average loss of about 47%. That shorter-term reading included coins active within 30 days, whereas the September figure covers 365 days. The two percentages therefore cannot be treated as a direct measure of recovery for the same traders.
Why XRP Can Rally While Traders Remain Underwater
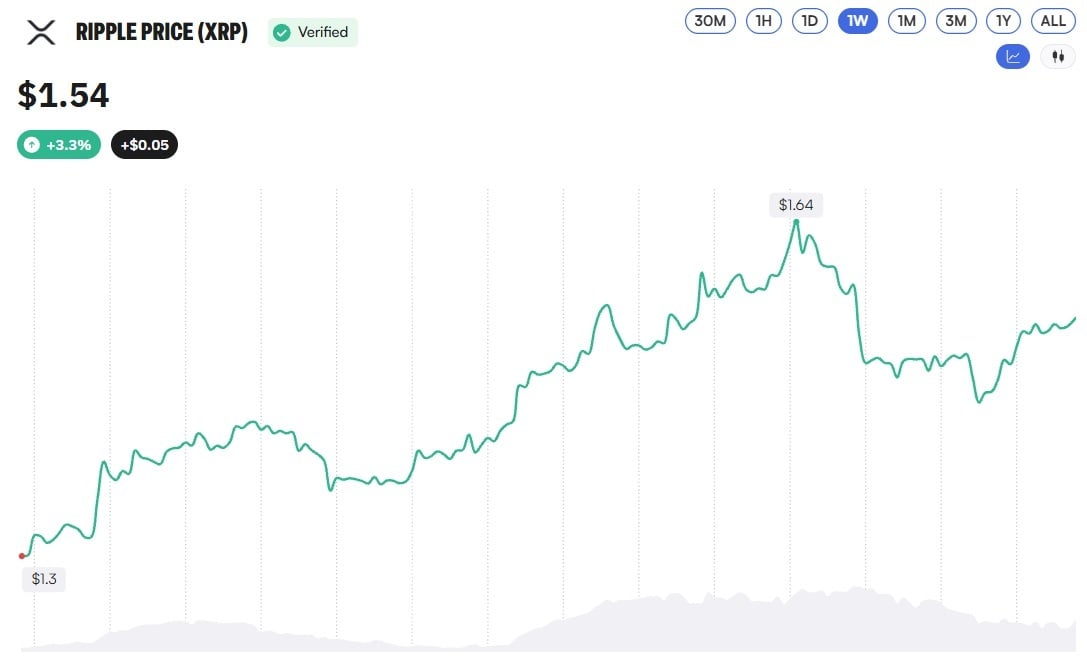
A rebound can lift XRP’s price without fully reversing earlier declines. By Sept. 1, the token was down about 27% for the year. Someone who acquired XRP at a higher price could still face a paper loss after a later rally. Santiment’s negative September reading shows that this remained true for the coins in its 365-day calculation as a group.
Price returns also measure something different from activity on the XRP Ledger. XRP is the native asset of the XRP Ledger, where it supports transactions and other network functions. The network can process more transactions while the average acquisition value of recently active XRP remains above its current price. In Santiment’s five-coin comparison, that gap was still visible for XRP and dogecoin on Sept. 23.



